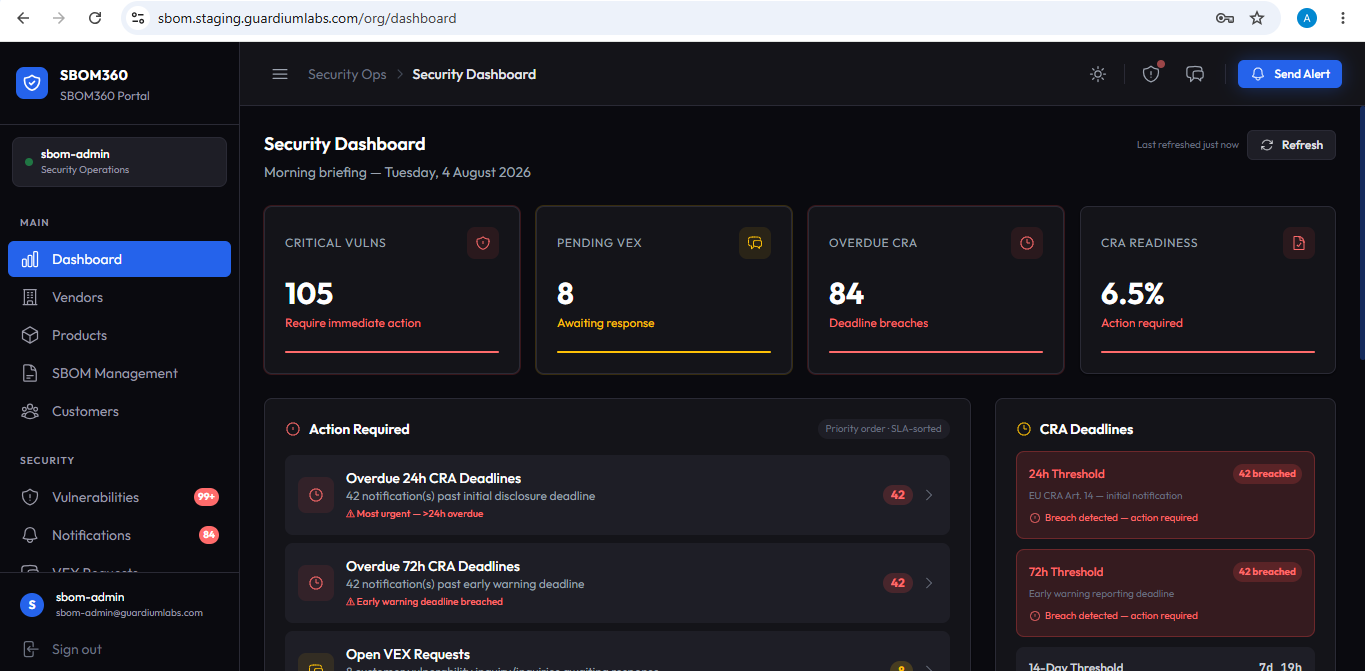
Security Dashboard
The Security Dashboard is the organization's home page — a morning briefing that surfaces exactly what needs attention today. It refreshes automatically and can be refreshed manually with the Refresh button in the top-right corner.
Purpose
Give the security team a single, prioritized view of critical vulnerabilities, pending VEX requests, and recent scan activity — without needing to visit every individual page.
Layout and features
| Area | What it shows |
|---|---|
| Traffic-light summary cards | Headline metrics — Critical Vulnerabilities and Pending VEX — each colour-coded green, yellow, or red and clickable to jump to the relevant page. |
| Action Required | A priority-sorted queue of everything needing attention today: open VEX requests, and unreviewed critical or high vulnerabilities. Each row shows a count and links straight to the relevant queue. |
| What's New | Scan activity since your last login, showing which SBOMs were recently scanned, their new critical/high counts, and whether the SBOM is the current version for its product. |
| Portfolio Overview | Quick counts of active vendors, active customers, total products, and high-severity vulnerabilities, each linking to its management page. |
| Recent Notifications Sent | The most recent customer notifications, with a status dot and badge, linking to each notification's detail page. |
Available actions
- Click any summary card, action-queue row, or portfolio stat to navigate directly to the relevant page (Vulnerabilities, VEX Requests, Notifications, Vendors, Customers, or Products).
- Click Refresh to reload every widget with the latest data.
- Click through from Recent Notifications Sent to open a notification's detail page.
Tip
Check the Action Required panel first thing each day — it is sorted so the most time-sensitive items always appear at the top.